Three reports from the National Endowment for the Arts reveal new findings about the impact of arts and cultural industries on GDP, as well as how and why Americans participate in certain arts activities. The data for the three reports is all from 2012, so for the first time the NEA can show a comprehensive view of a single year in the life of the arts and cultural sector from three different angles: supply, demand, and motivations for consumer behavior. The new information will help arts providers and others more effectively understand and develop strategies to engage individuals and communities in the arts.
“The implications from this research are significant," said NEA Chairman Jane Chu. "The findings show that there is great diversity in how people engage in the arts, and this gives us a framework to use our creativity to innovate new ways to reach these audiences.” “With the creation of new data analyses like this one - which shows how arts and culture contribute to GDP - the Department of Commerce is providing a more detailed picture of what drives the U.S. economy, growth, and job creation,” said Secretary of Commerce Penny Pritzker, referring to the Bureau of Economic Analysis satellite account data discussed below in report 3. “Making new data available is another example of how the government is working harder and smarter to produce relevant statistics that better inform individuals, businesses, and decision-makers.”
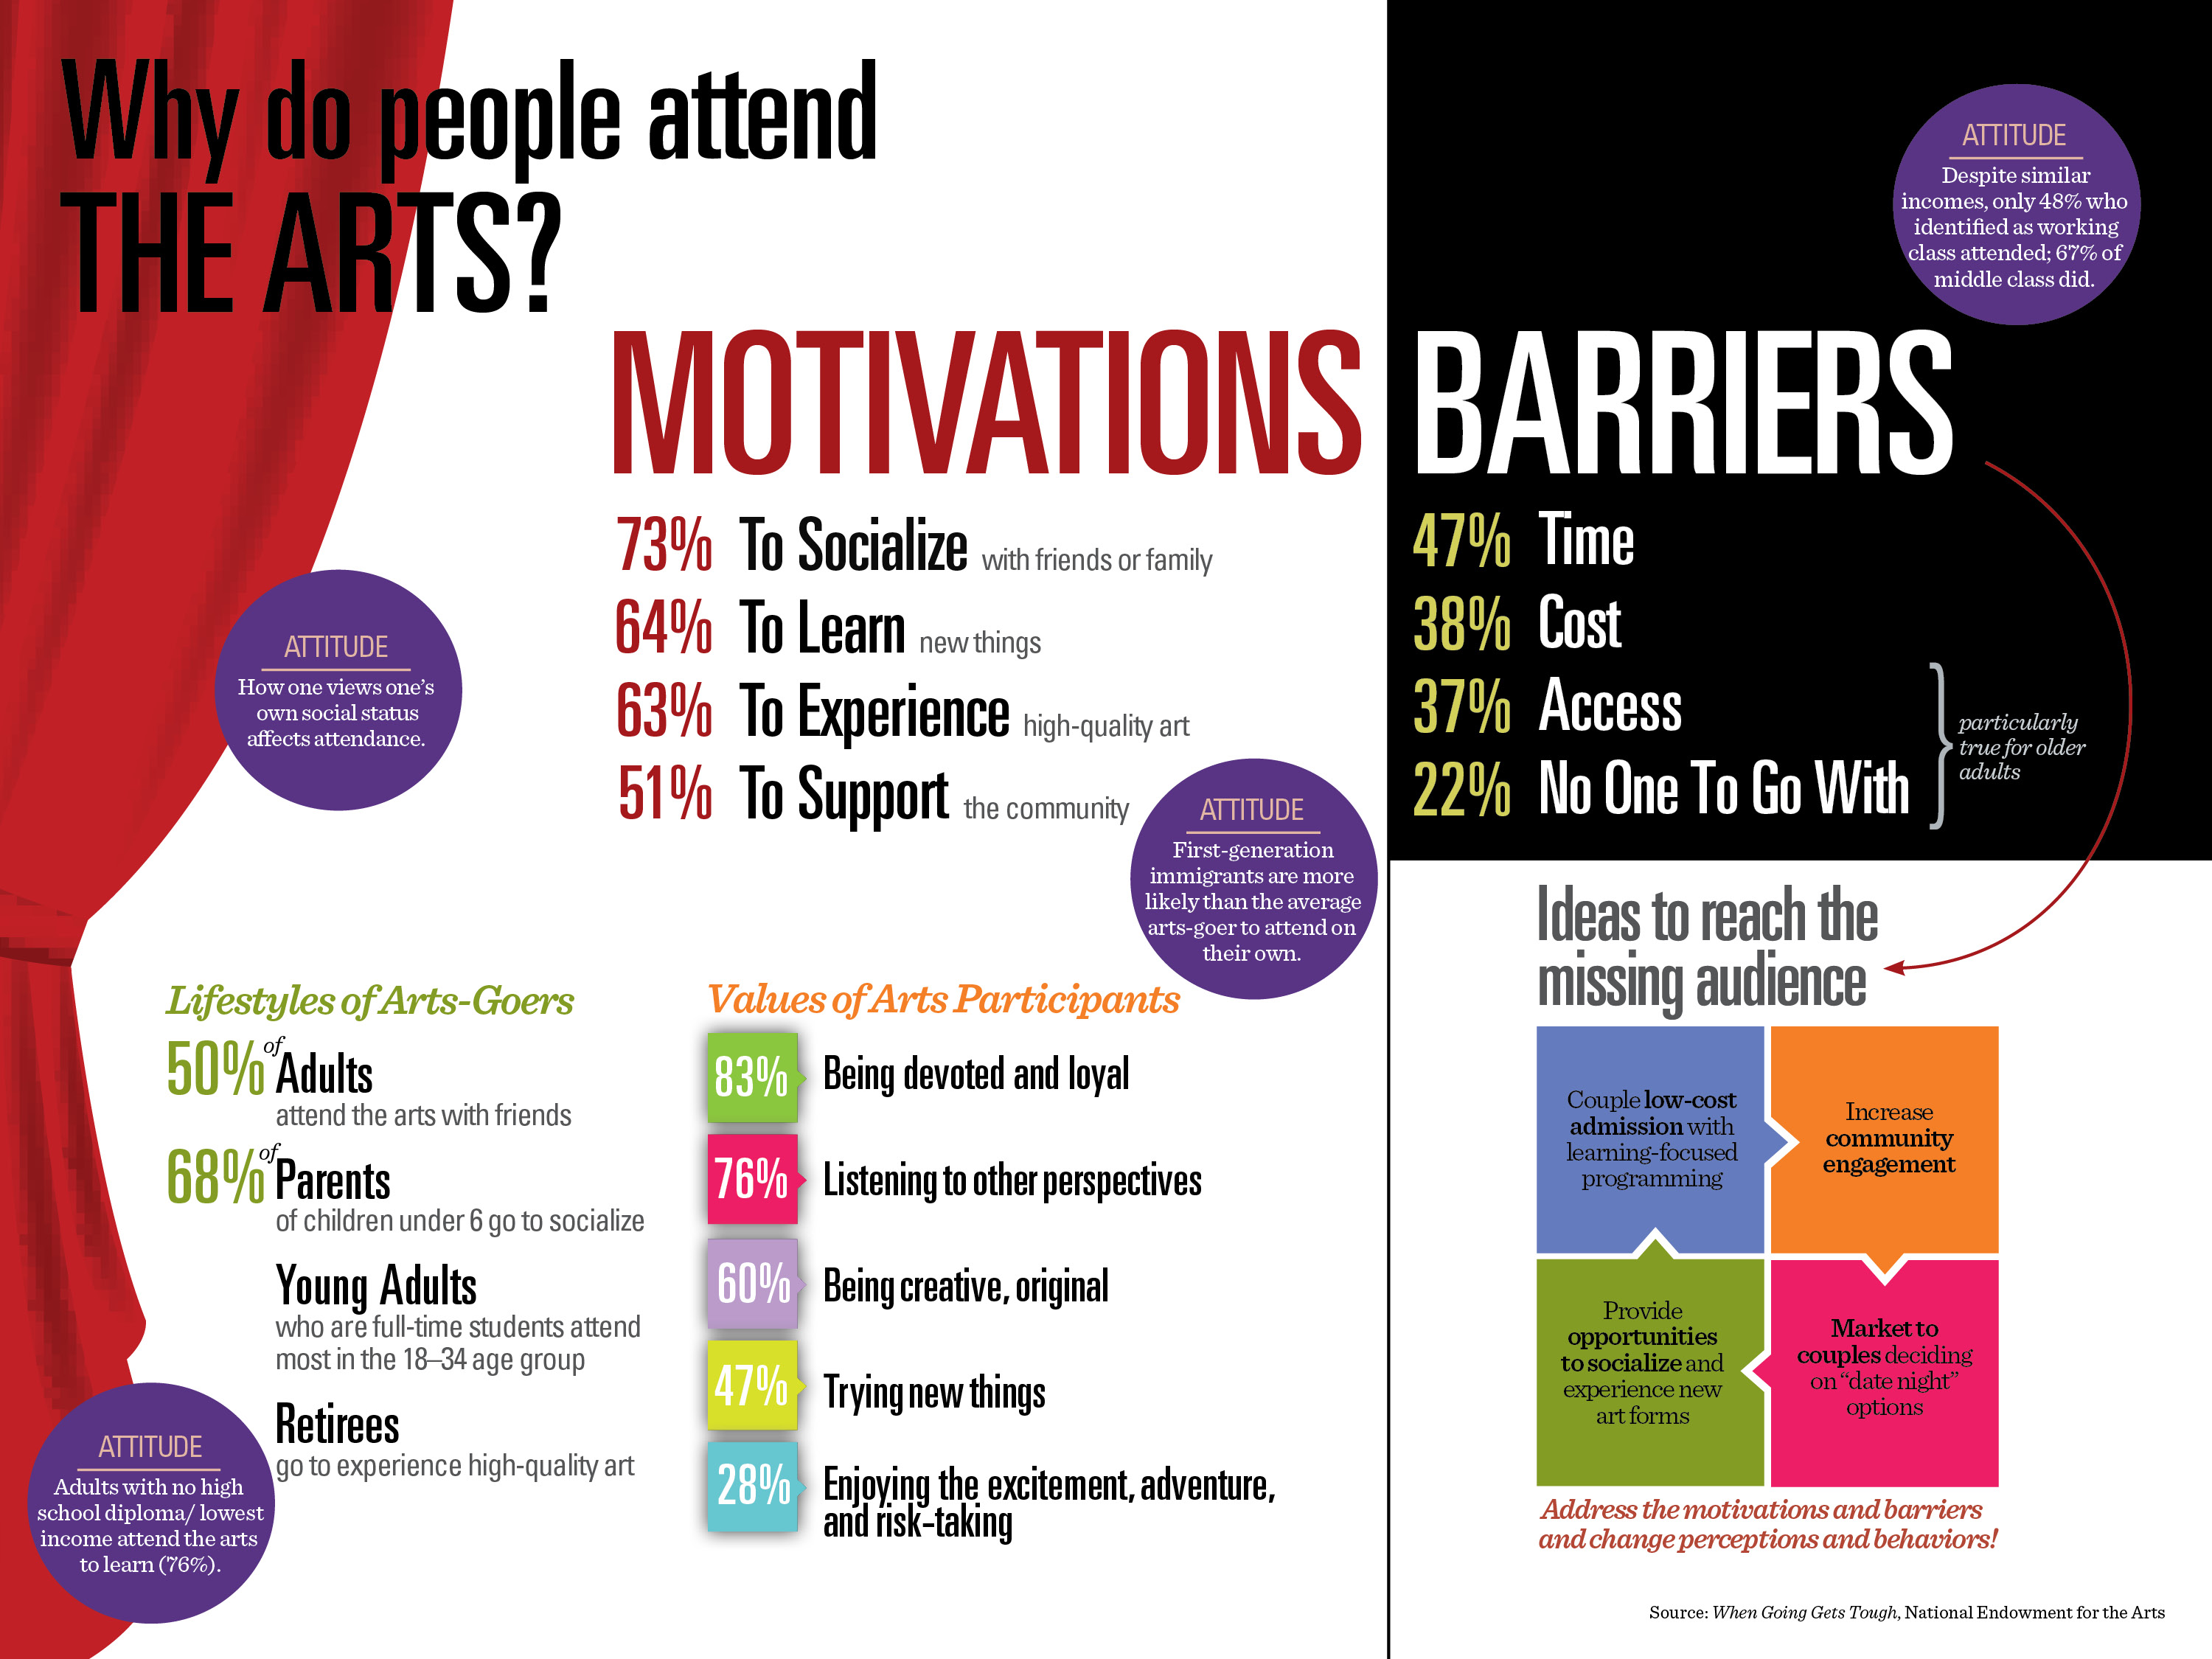
Report 1: When Going Gets Tough: Barriers and Motivations Affecting Arts Attendance
In 2012, the National Endowment for the Arts partnered with the General Social Survey to ask why people attend arts events (specifically music, dance, theater, and visual arts). This new report looks beyond demographics to discover the attitudes, motivations, and barriers for attending the arts at different life stages—the first time the NEA has published a report on this type of data. There were common barriers for the 13 percent — 31 million adults — who were interested in a specific event, but did not go for some reason:
- Nearly 60 percent of people with children under age six said lack of time was the greatest single barrier to attendance. This finding could inspire arts providers to develop more family-friendly program options.
- Some noted that the location was too difficult to get to. This was especially a problem for retirees, older adults, and adults with physical disabilities. If we're quantifying the value of what we often term "access to the arts," it's about 11 million lost audience members or exhibit-goers.
- Twenty-two percent of those who wanted to attend but chose not to said a barrier was not having someone to go with.
Motivations include:
- Top reasons Americans attend the arts (performances and exhibits) include socializing with friends or family members (73 percent); learning new things (64 percent); and supporting the community (51 percent).
- Despite similar household incomes and education, people who call themselves middle-class were more likely to attend the arts than those who identified themselves as working class. Thwarted interest, rather than lack of interest, may be the cause for lower attendance rates among some audiences.
- Life stages — pursuing higher education, marriage, child-rearing, and retirement — are often more predictive than age alone, as a factor in attending the arts. For example, parents with young children under age six more often cited socializing with family or friends, learning new things and celebrating cultural heritage when they attended performances accompanied by their children.
- For more key findings, go to Arts Data Profile #4.
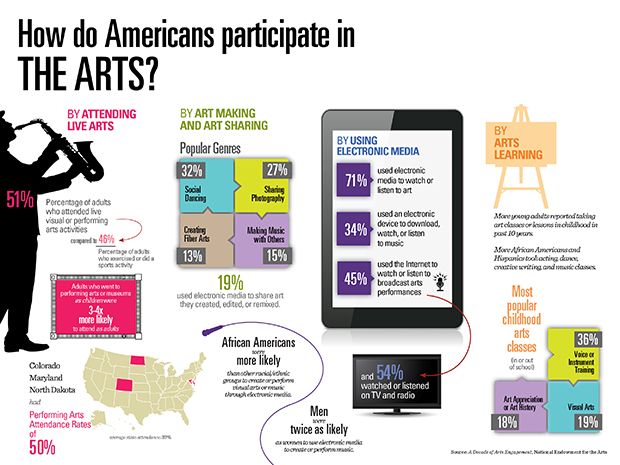
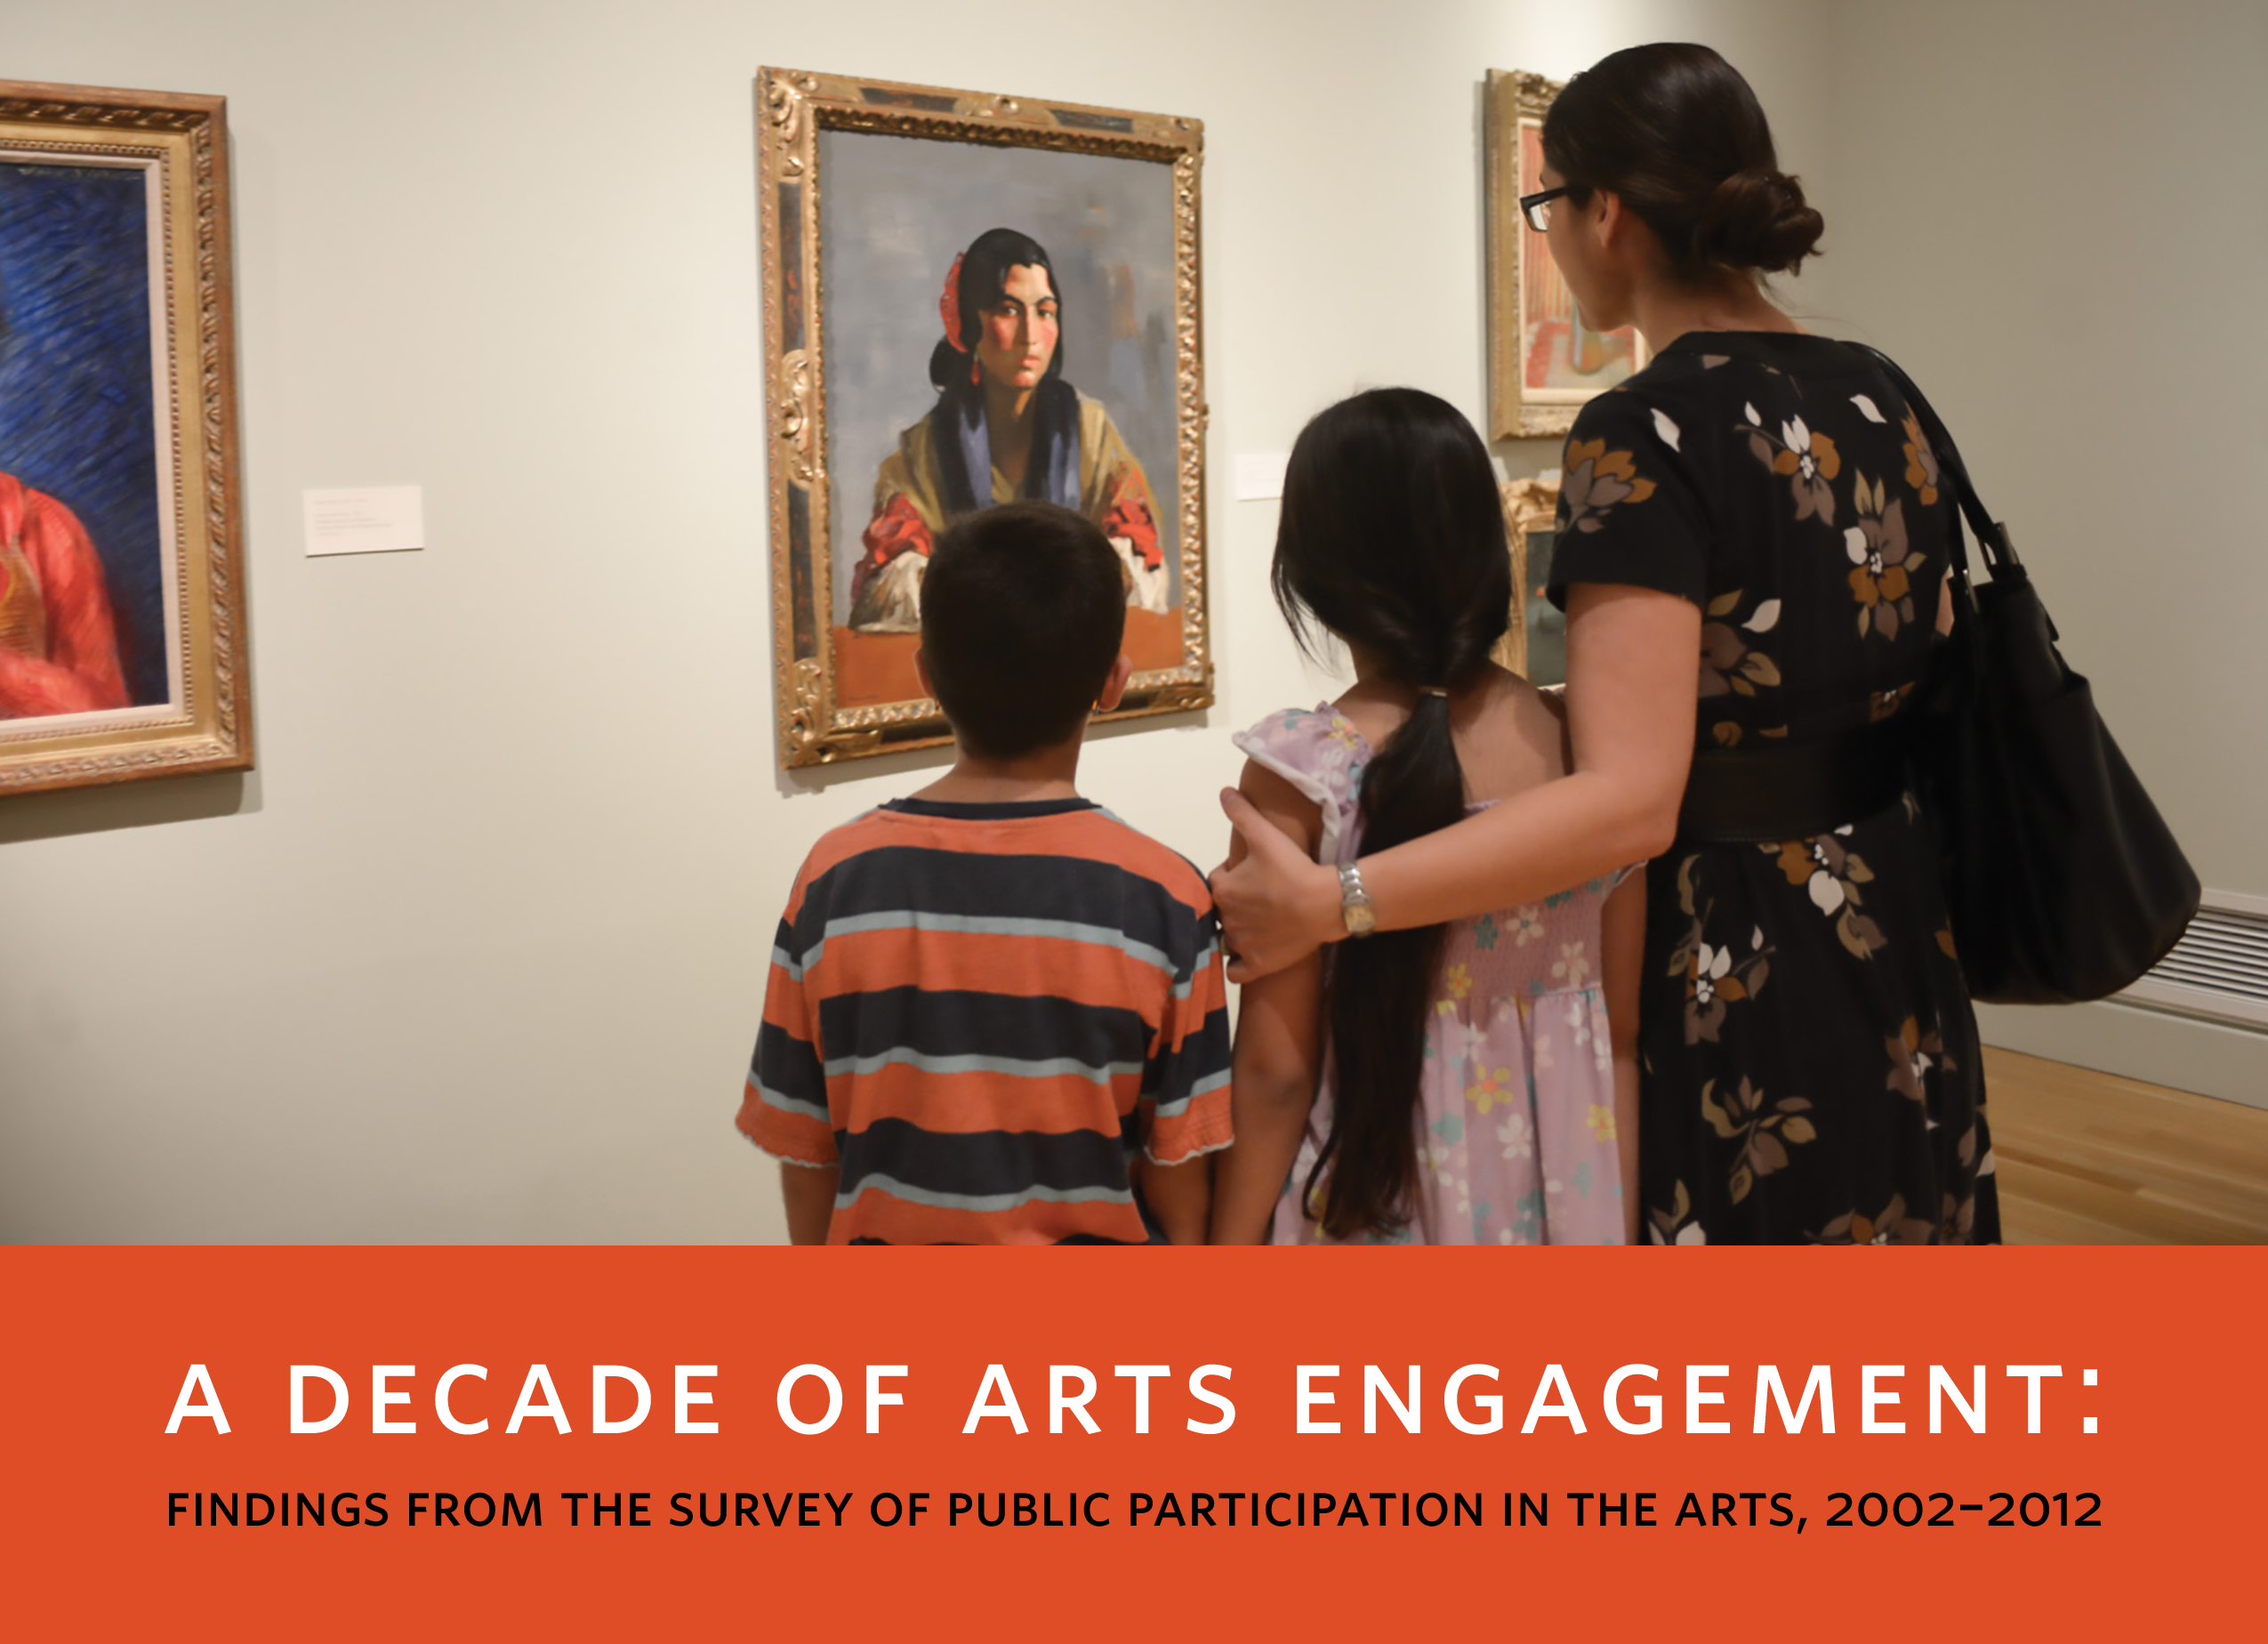
Report 2: A Decade of Arts Engagement: Findings from the Survey of Public Participation in the Arts, 2002-2012
The Survey of Public Participation in the Arts (SPPA) is the largest and most comprehensive survey of U.S. arts participation, with a total sample size exceeding 37,000 adults, ages 18 and over. The latest SPPA compares arts participation rates based on surveys from 2002, 2008, and 2012, as well as regional, state, and metro-area statistics.
- A new question in the 2012 survey revealed that adults who attended performing arts or visited museums as children were three to four times as likely to see shows or visit museums as adults. Exposure to the arts in childhood turns out to be a stronger predictor of adult arts participation than education, gender, age, or income.
- Technology is a great enabler of arts creation and participation. In 2012, nearly three-quarters of American adults — about 167 million people — used electronic media to view or listen to art, and large proportions of adults used electronic media to create music or visual art.
- Women participate in the arts at higher rates than men across all categories, except a few. For example, men are more than twice as likely as women to use electronic media to create or perform music, and they are also more likely to create visual art online.
- More than half (54 percent) of all American adults attended at least one live music, theater, or dance performance in the past year, or they went to view an art exhibit. That's about 120 million people.
- For more key findings, go to Arts Data Profile #5.
Report 3: The Arts and Cultural Production Satellite Account (ACPSA)
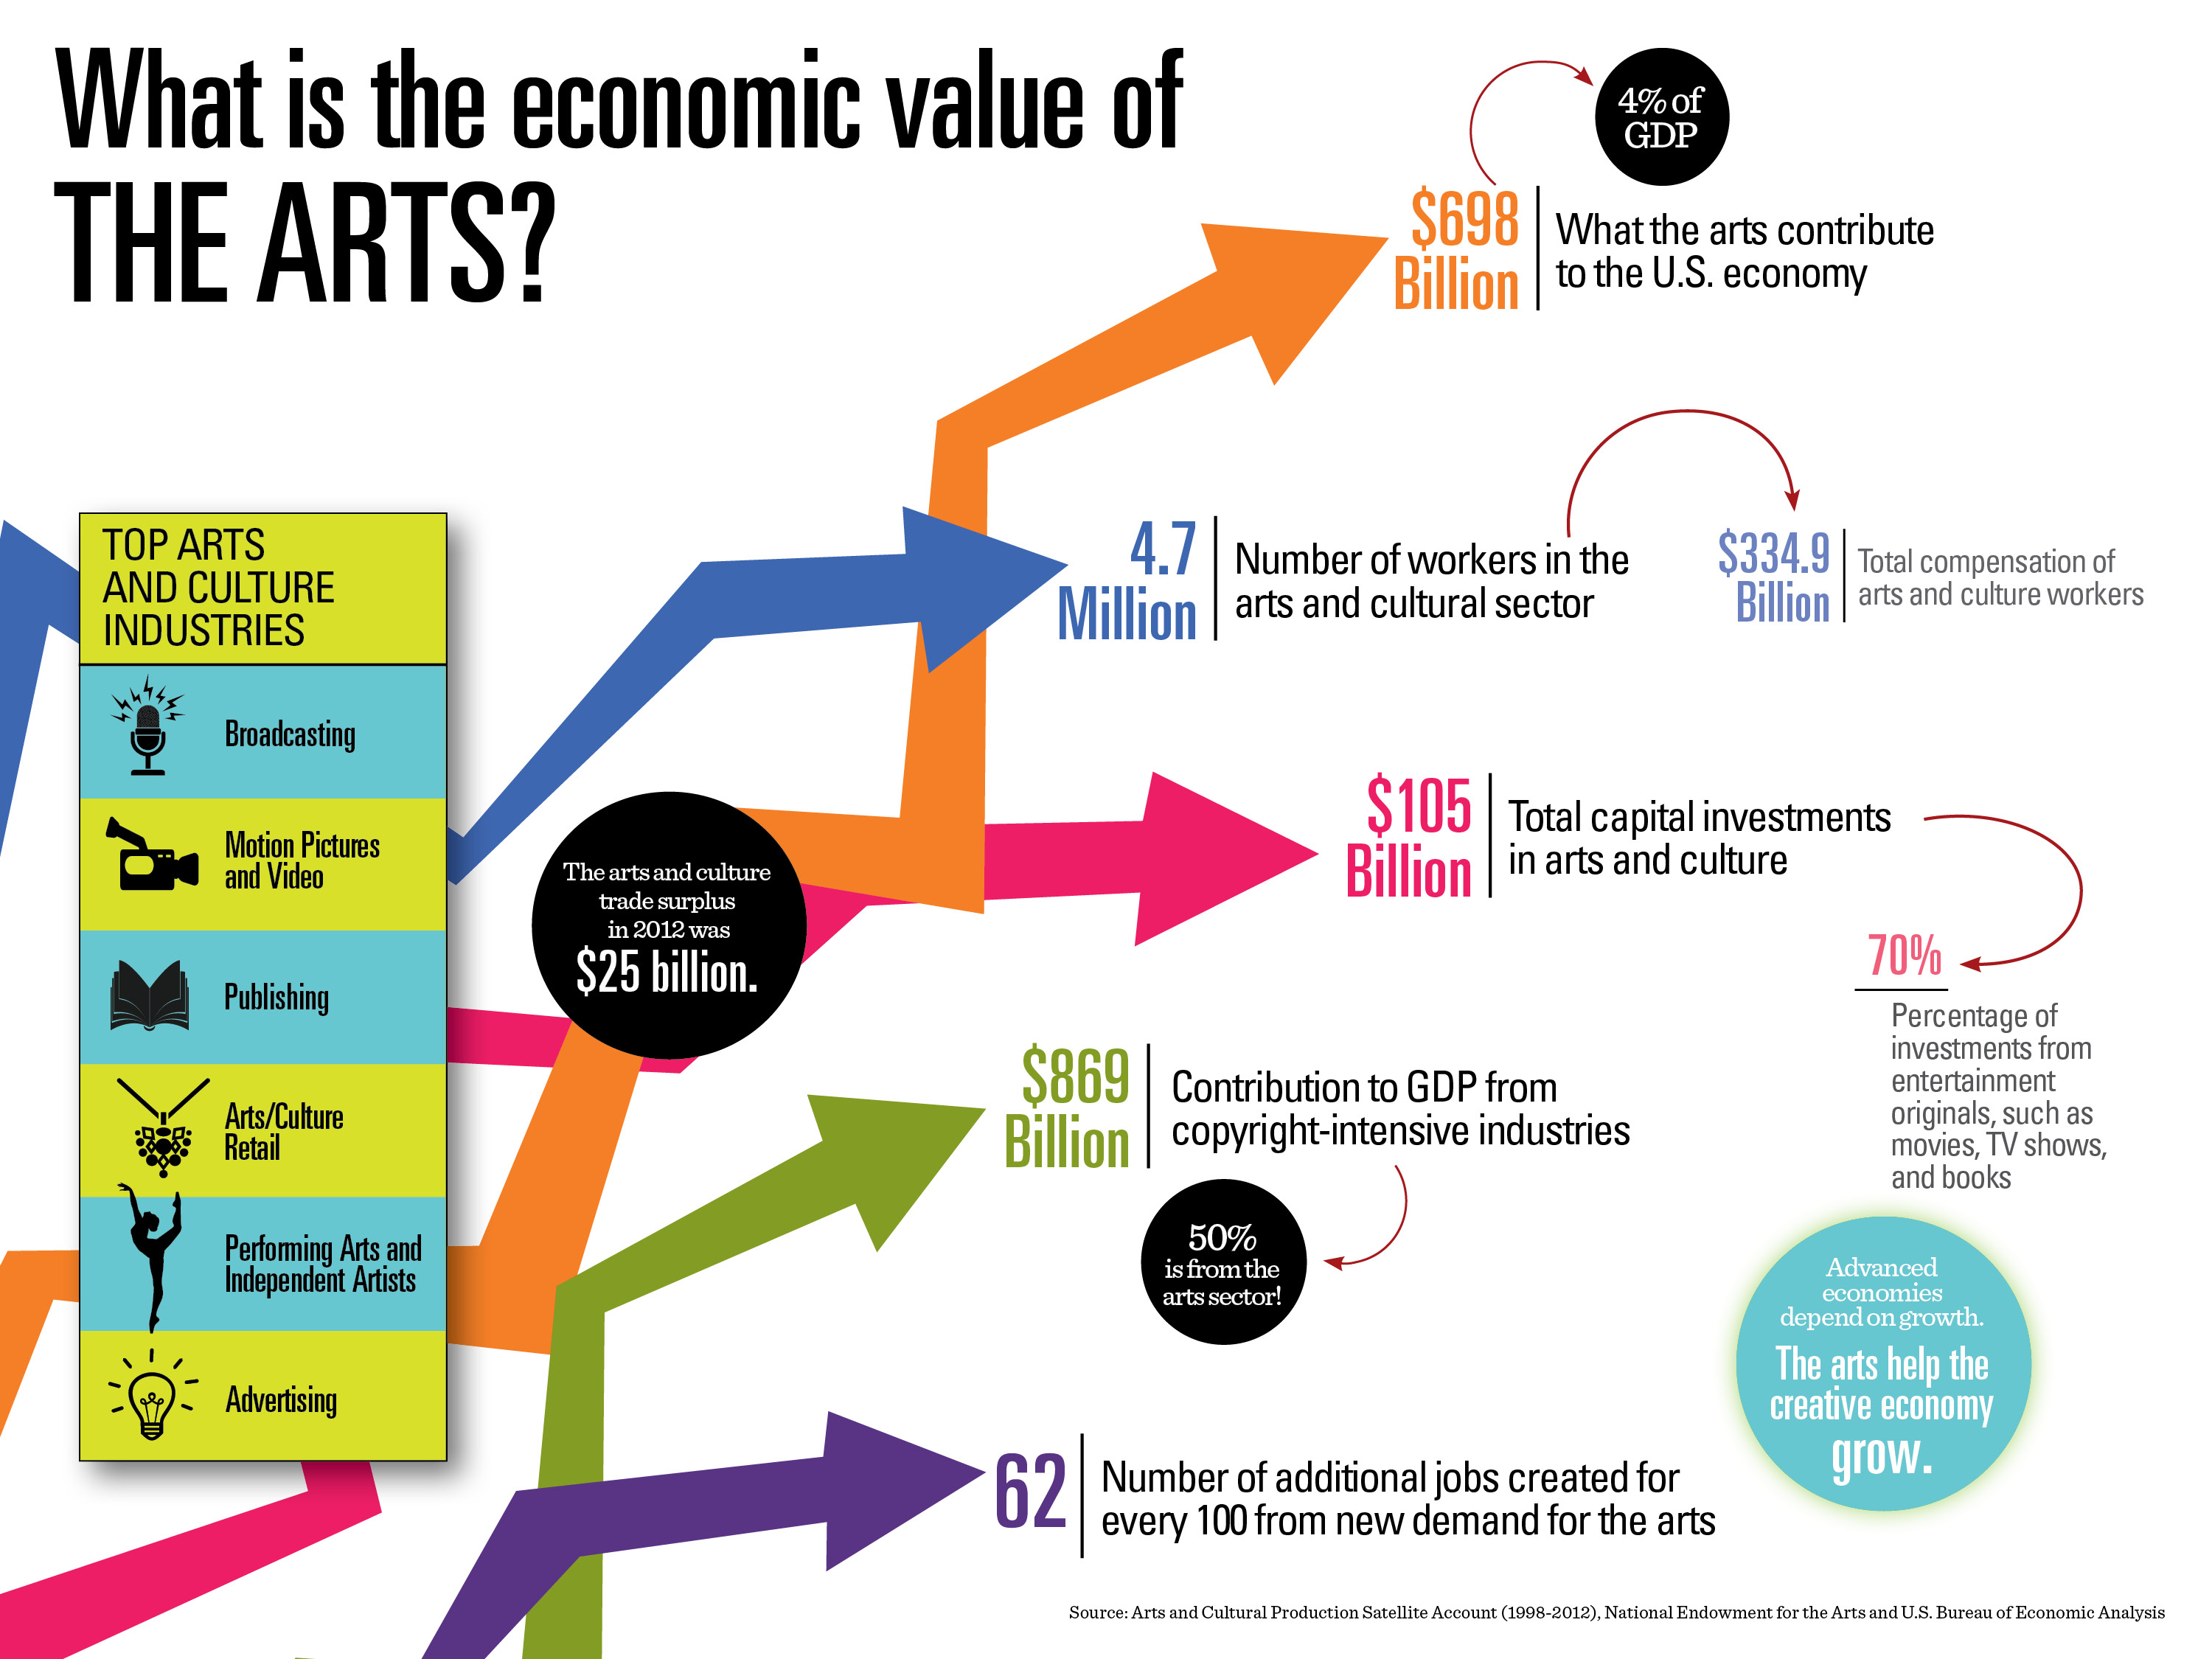
The ACPSA, a partnership between the NEA and the Department of Commerce's Bureau of Economic Analysis, is the first federal effort to provide an in-depth analysis of the arts and cultural sector's contributions to current-dollar gross domestic product (GDP), a measure of the final dollar value of all goods and services produced in the United States. The revised estimates reveal the arts are a bigger driver of GDP and jobs than previously estimated. Among the new estimates are:
- In 2012, arts and cultural production contributed more than $698 billion to the U.S. economy, or 4.32 percent to the U.S. Gross Domestic Product, more than construction ($586.7B) or transportation and warehousing ($464.1B).
- 4.7 million workers were employed in the production of arts and cultural goods, receiving $334.9 billion in compensation.
- Arts and cultural spending has a ripple effect on the overall economy, boosting both commodities and jobs. For example, for every 100 jobs created from new demand for the arts, 62 additional jobs are also created.
- The Bureau of Economic Analysis highlights the Arts and Cultural Production Satellite Account in the January edition of the Survey of Current Business, widely read by economists and financial analysts to understand the state of the U.S. economy.
- For more key findings, go to Arts Data Profile #6.
The underlying data for the SPPA and GSS research reports are available to researchers, policymakers, and arts practitioners via a brand-new online resource also being launched today. Through the National Archive of Data on Arts & Culture (NADAC), the NEA provides free access to the data files and related resources, as well as a user-friendly platform for querying the data. Visit NADAC to learn more. The NEA is the only federal agency to conduct periodic analyses of the value and impact of the arts in American life. For nearly 40 years, the NEA Office of Research & Analysis has produced research publications, conferences, and data sources on arts-related topics of interest to policymakers, educators, journalists, cultural researchers and practitioners, and the general public. Many of these products have emerged in consultation or collaboration with other federal agencies such as the U.S. Census Bureau and the Bureau of Labor Statistics. In recent years, the NEA launched a new research grant opportunity to support research that investigates the value and/or impact of the arts.